怎么在CentOS7系統中搭建Prometheus監控-創新互聯
今天就跟大家聊聊有關怎么在CentOS7系統中搭建Prometheus 監控,可能很多人都不太了解,為了讓大家更加了解,小編給大家總結了以下內容,希望大家根據這篇文章可以有所收獲。

簡介
prometheus可以拆分成多個節點進行指標收集。
安裝環境:CentOS7
wget -c https://github.com/prometheus/prometheus/releases/download/v2.23.0/prometheus-2.23.0.linux-amd64.tar.gz
tar zxvf prometheus-2.23.0.linux-amd64.tar.gz -C /opt/
cd /opt/
ln -s prometheus-2.23.0.linux-amd64 prometheus
cat > /etc/systemd/system/prometheus.service <<EOF
[Unit]
Description=prometheus
After=network.target
[Service]
Type=simple
WorkingDirectory=/opt/prometheus
ExecStart=/opt/prometheus/prometheus --config.file="/opt/prometheus/prometheus.yml"
LimitNOFILE=65536
PrivateTmp=true
RestartSec=2
StartLimitInterval=0
Restart=always
[Install]
WantedBy=multi-user.target
EOF
systemctl daemon-reload
systemctl enable prometheus
systemctl start prometheus
配置Prometheus
這里配置的是監聽/opt/prometheus/servers/目錄下的json文件
cat > /opt/prometheus/prometheus.yml <<EOF
# my global config
global:
scrape_interval: 15s # Set the scrape interval to every 15 seconds. Default is every 1 minute.
evaluation_interval: 15s # Evaluate rules every 15 seconds. The default is every 1 minute.
# scrape_timeout is set to the global default (10s).
# Alertmanager configuration
alerting:
alertmanagers:
- static_configs:
- targets:
# - alertmanager:9093
# Load rules once and periodically evaluate them according to the global 'evaluation_interval'.
rule_files:
# - "first_rules.yml"
# - "second_rules.yml"
# A scrape configuration containing exactly one endpoint to scrape:
# Here it's Prometheus itself.
scrape_configs:
# The job name is added as a label `job=<job_name>` to any timeseries scraped from this config.
- job_name: 'prometheus'
# metrics_path defaults to '/metrics'
# scheme defaults to 'http'.
static_configs:
- targets: ['localhost:9090']
- job_name: 'servers'
file_sd_configs:
- refresh_interval: 61s
files:
- /opt/prometheus/servers/*.json
EOF
systemctl restart prometheus
json格式
 [
[ {
"targets": [
"192.168.1.164:9100"
],
"labels": {
"instance": "192.168.1.164",
"job": "node_exporter"
}
},
{
"targets": [
"192.168.1.167:9100"
],
"labels": {
"instance": "192.168.1.167",
"job": "node_exporter"
}
}
]
安裝node_exporter
安裝到/opt/node_exporter路徑下,保持默認的端口
https://github.com/prometheus/node_exporter/releases/download/v1.0.1/node_exporter-1.0.1.linux-amd64.tar.gz
tar zxvf node_exporter-1.0.1.linux-amd64.tar.gz -C /opt/
cd /opt/
ln -s node_exporter-1.0.1.linux-amd64 node_exporter
cat > /etc/systemd/system/node_exporter.service <<EOF
[Unit]
Description=node_exporter
After=network.target
[Service]
Type=simple
WorkingDirectory=/opt/node_exporter
ExecStart=/opt/node_exporter/node_exporter
LimitNOFILE=65536
PrivateTmp=true
RestartSec=2
StartLimitInterval=0
Restart=always
[Install]
WantedBy=multi-user.target
EOF
systemctl daemon-reload
systemctl enable node_exporter
systemctl start node_exporter
圖形展示
直接安裝grafana進行展示
yum -y install https://dl.grafana.com/oss/release/grafana-7.3.6-1.x86_64.rpm
systemctl enable grafana-server
systemctl start grafana-server
啟動之后,grafana默認監聽的是3000端口,直接使用瀏覽器進行訪問就可以了,默認用戶名密碼是admin/admin,第一次登陸之后會提示修改。

配置數據源:鼠標左邊的菜單 Configuration -> Data Source -> Add data source -> 選擇prometheus -> url那欄填入prometheus的地址就可以了 -> 最后 Save & test 就可以了。
grafana.com/grafana/dashboards 官網已經有人做好的模板,我們直接import進來就可以了。
導入面板:鼠標左邊的菜單 Dashboards -> Import -> 填入id -> Load -> 選擇數據源就可以了。
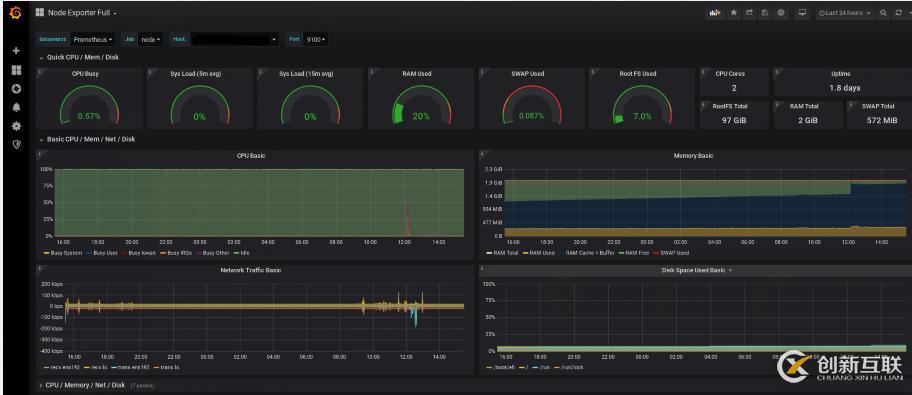
我經常用的是:1860 、8919 這兩個來查看node_exporter監控
看完上述內容,你們對怎么在CentOS7系統中搭建Prometheus 監控有進一步的了解嗎?如果還想了解更多知識或者相關內容,請關注創新互聯行業資訊頻道,感謝大家的支持。
原文地址:https://www.toutiao.com/i6914917162675192324/
網頁標題:怎么在CentOS7系統中搭建Prometheus監控-創新互聯
分享路徑:http://www.yijiale78.com/article46/disehg.html
成都網站建設公司_創新互聯,為您提供移動網站建設、關鍵詞優化、品牌網站設計、手機網站建設、自適應網站、網頁設計公司
聲明:本網站發布的內容(圖片、視頻和文字)以用戶投稿、用戶轉載內容為主,如果涉及侵權請盡快告知,我們將會在第一時間刪除。文章觀點不代表本網站立場,如需處理請聯系客服。電話:028-86922220;郵箱:631063699@qq.com。內容未經允許不得轉載,或轉載時需注明來源: 創新互聯

- 新時代|服務器托管應具備的優勢有哪些? 2021-03-17
- 哪些行業適合美國高防服務器托管業務? 2022-10-09
- 服務器托管和服務器租用是一樣的嗎?有什么區別? 2022-10-08
- 如何判斷服務器托管哪個好? 2021-03-13
- 香港服務器托管和租用服務器有什么區別?網站訪問速度慢的原因是什么? 2022-10-04
- 服務器托管的收費標準通常是怎樣制定的? 2016-10-05
- 為什么企業進行服務器托管更好? 2022-10-03
- 為何服務器托管成為企業的首選? 2022-10-05
- 服務器托管帶寬選擇有什么依據? 2022-10-08
- 服務器租用與服務器托管的區別 2021-02-07
- 為什么有服務器托管服務? 2021-03-18
- 服務器托管與虛擬主機租用有什么區別? 2022-06-19